旋风分离器练习 7 - 分析结果
本练习介绍了如何在仿真期间及之后分析结果。要隐藏 CAD 曲面 (非流体域),请在
 “CAD 主体”(CAD Bodies)
 和
 “Flow Analysis 主体”(Flow Analysis Bodies)
 之间进行切换。单击
 “XY 坐标图面板”(XYPlot Panel)
 查看 XY 坐标图。
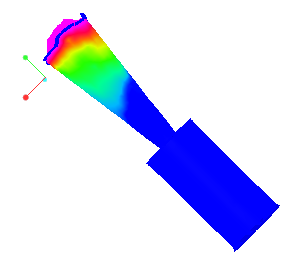
查看边界处的压力等值线
| 压力: [Pa] : 流量 101350 101320 |
1. 在“边界条件”(Boundary Conditions) 的“普通边界”(General Boundaries) 下,选择 CYCLONE_4_FLUID_1:Body 1。
2. 在“属性”(Properties) 面板的“视图”(View) 选项卡中,在“曲面”(Surface) 下选择以下选项值:
◦ “保留绘图”(Keep drawing) -“是”(Yes)
◦ “网格”(Grid) - “否”(No)
◦ “轮廓”(Outline) - “否”(No)
◦ “变量”(Variable) - “压力 : [Pa] : 流量”(Pressure: [Pa] : Flow)
◦ “最小”(Min) - 101320
◦ “最大”(Max) - 101350
查看域中的流线
1. 在
“后处理”(Post-processing) 组中,单击
 “流线图”(Stream Lines)
。在
 “结果”(Results)
 >
“流线”(Streamlines)下,已选择
Streamline 01。
Streamline 01“属性”(Properties) 对话框打开。
2. 在“属性”(Properties) 面板的“模型”(Model) 选项卡中,选择以下选项值:
◦ “线条粗细”(Line Thickness) - 0.007
◦ “动画时长”(Animation Time Size) - 0.0001
3. 在“属性”(Properties) 面板的“视图”(View) 选项卡中,在“曲面”(Surface) 下选择以下选项值:
◦ “变量”(Variable) - “速度大小 : [m/s] : 流量”(Velocity Magnitude: [m/s] : Flow)
◦ “最小”(Min) - 0.0
◦ “最大”(Max) - 5.95
4. 在 Flow Analysis 树中的“普通边界”(General Boundaries) 下,选择 BC_00002。
5. 在“属性”(Properties) 面板的“模型”(Model) 选项卡中,对于“流线”(Streamline),将“释放粒子”(Release Particle) 设置为 Yes。
以低于 1 m/s 的速度查看点的等值面
| 速度大小: [m/s]: 流量 1.0 0.00000 |
1. 单击
 Flow Analysis
 >
 “等值面”(Isosurface)
。新要素
Isosurface 01 将显示在 Flow Analysis 树中的
“衍生曲面”(Derived Surfaces) 下。
2. 选择 Isosurface 01。
3. 在“属性”(Properties) 面板的“模型”(Model) 选项卡中,设置以下选项值:
◦ “等值面变量”(Isosurface Variable) - “速度大小 : [m/s] : 流量”(Velocity Magnitude: [m/s] : Flow)
◦ “类型”(Type) -“低于值”(Below Value)
◦ “值”(Value) - 1.0
4. 在“属性”(Properties) 面板的“视图”(View) 选项卡中,为“曲面”(Surface) 设置以下选项值:
◦ “变量”(Variable) - “速度大小 : [m/s] : 流量”(Velocity Magnitude: [m/s] : Flow)
◦ “最小”(Min) - 0.0
◦ “最大”(Max) - 1.0
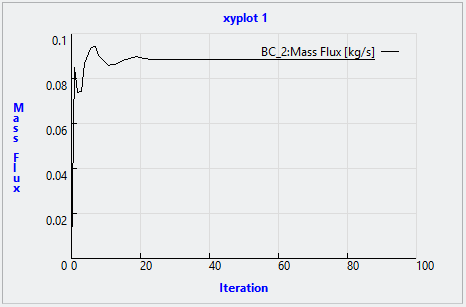
绘制出口边界处的质量通量图
1. 在 Flow Analysis 树中的“结果”(Results) 下,单击“边界”(Boundaries)。
2. 选择 BC_00002。
3. 单击

“XY 坐标图”(XYPlot)。新要素
xyplot1 将添加到 Flow Analysis 树中的
“结果”(Results) >
“衍生曲面”(Derived Surfaces) >
“XY 坐标图”(XY Plots) 中。
4. 选择 xyplot1。
5. 在“属性”(Properties) 面板的“视图”(View) 选项卡中,设置“变量”(Variable)-“质量通量”(Mass Flux)。
6. 根据需要单击
 “停止”(Stop)
 和
 “运行”(Run)
。
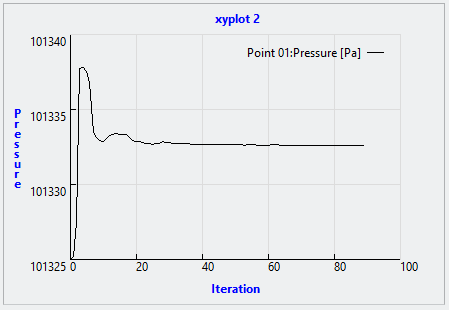
绘制监控点处的压力图
1. 在 Flow Analysis 树中的“结果”(Results) 下,单击“监控点”(Monitoring Points)。
2. 选择 Point01。
3. 单击
“XY 坐标图”(XYPlot)。新要素
xyplot2 将添加到 Flow Analysis 树中的
“结果”(Results) >
“衍生曲面”(Derived Surfaces) >
“XY 坐标图”(XY Plots) 中。
4. 选择 xyplot2。
5. 在“属性”(Properties) 面板的“视图”(View) 选项卡中,设置“变量”(Variable) - “压力”(Pressure)。
6. 根据需要单击
“停止”(Stop) 和
“运行”(Run)。